|
Winegrowers and their advisers use three kinds of models
to help them decide on the management of Grape Downy Mildew :
1. Rules of thumb: 10-10-10 rule
Provide a rough estimation of the situation based on empirical knowledge.
2. Static models: e.g.: EPI, DMCast, MILVIT,
VitiMeteo, and the simple models integrated in 'on-farm' weather station software
Provide an improved estimation of the situation by automated application of
tables and algorithms. Each wetness event is treated
separately and equally.
3. Dynamic population models
Provide the best risk assessment as infection calculations are based on the
growth of the disease population trough the year.
Dynamic models use all available empirical and scientific knowledge to
calculate the development of the disease population from measured and
forecasted weather data. Not only the weather conditions, but also the
population itself is an important factor in the calculation of the infection
risk. Under the same weather conditions, infections become more severe as the
disease population grows and more inoculum is available.
This is the
only way to use scientific data in their whole potential. Dynamic models
apply the average outcomes of an experiment, as well as the variation in
response to the population. New information can easily be
implemented. Differences between grape varieties as longer incubation periods
and reduced sporulation for interspecific grape varieties, yielding lower disease increase rates for less
susceptible varieties can easily be included.
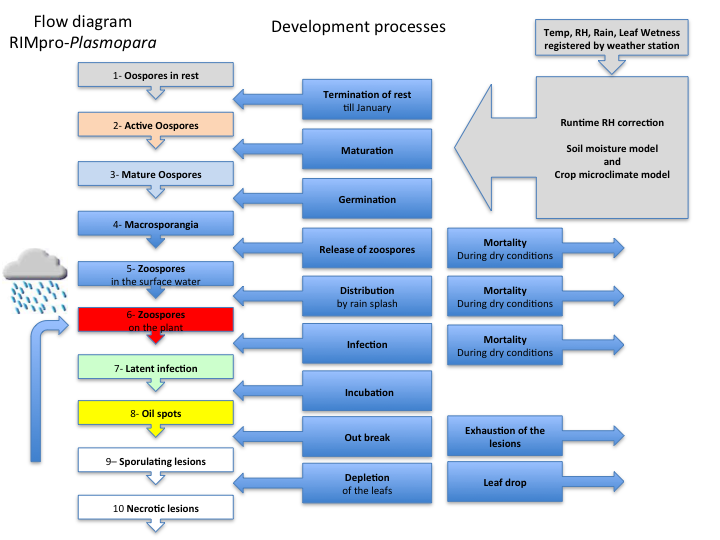
The disease model is not directly driven by the
registered climate data. Crosschecks between parameter values and runtime RH
correction are preformed on the incoming data. Small data gabs are
interpolated. The resulting values are used to estimate the crop
microclimate, and soil surface moisture content. These values are used to
drive the sub-processes of the disease model.
|